The CA-USA Promise-to-Pay Index is a research benchmark from Collection Agency USA (CA-USA) that measures whether business customers keep specific promises to pay overdue commercial invoices, meaning a stated amount by a stated date, tracked both by number of promises and by dollars received.
Quick answer: The Collection Agency USA (CA-USA) Promise-to-Pay Index measures what happens after a business customer commits to paying a specific amount by a specific date: whether the first promise is kept, how much of the promised cash actually arrives, and how reliability changes with each repeated promise, account age, balance and industry. This methodology edition publishes the definitions only. No CA-USA kept-rate figures appear here, and none will until several hundred qualifying promises have matured and been reconciled.

“We’ll pay Friday.”
Every AR team has heard it. It gets typed into a collection note, mentioned in the Monday meeting, maybe added to a spreadsheet. Then Friday comes and goes, and the note just sits there.
But that sentence is more than a note. It’s a dated, specific prediction about cash. And unlike most things in collections, you find out exactly whether it came true.
Did the money arrive? All of it? On time? If not, what did the customer promise next, and was that promise any better than the first?
Credit teams ask these questions every week. Yet there is surprisingly little standardized public data answering them for commercial B2B receivables. The CA-USA Promise-to-Pay Index is built to change that, starting with the part most benchmarks skip: agreeing on what’s being measured.
Article Index:
| Metric | What it measures |
|---|---|
| First-Promise Kept Rate | % of first commitments paid as promised |
| Dollar Fulfillment Rate | % of promised dollars actually received |
| Broken-Promise Recovery | Payments received within 7/30 days after a miss |
| Payment-Plan Completion | % of arrangements completed |
| Median Promise-to-Payment | Time from commitment to cash |
The Problem: Everyone Tracks Promises. Nobody Agrees What the Number Means.
Promise to pay (PTP) is one of the most widely cited collections KPIs. Look at how it’s defined, though, and the denominator changes from source to source:
| Source | How it defines the PTP rate |
|---|---|
| Thomson Reuters | Share of all collection calls made that end with a promise to pay |
| OpsDog | Promises obtained on outbound calls ÷ right-party contacts (calls that reached the correct person) |
| HighRadius | Number of promised payments ÷ total outstanding receivables |
Three respected sources, three different denominators. A team measuring against all calls and a team measuring against right-party contacts can do identical work and report very different numbers. And some published guidance simply tells collectors to push the PTP rate as close to 100% as possible.
There’s a bigger issue underneath. Every one of those definitions measures promise creation. None of them tells you whether the promise turned into money.
Consider two collectors:
- Collector A gets promises from 70% of the customers they reach.
- Collector B gets promises from only 50%.
On a PTP-creation dashboard, A wins easily. But if B’s customers pay what they promised and many of A’s promises quietly break, B is bringing in more cash. The metric that matters is the one that comes after the promise.
The infrastructure to measure that already exists. SAP’s collections tools record a promise to pay as a business partner’s agreement to pay specific amounts by specific dates, and its analytics surface open, overdue and broken promises. Oracle Advanced Collections reconciles incoming payments against open promises and automatically flags broken ones for follow-up. What’s missing isn’t the data model. It’s a transparent public benchmark of how commercial promises actually perform.
Why Promises Matter More Going Into 2027
The payment backdrop makes this timely. According to Intuit QuickBooks’ 2026 Small Business Late Payments Report, 59% of U.S. small businesses now carry invoices at least 30 days overdue, up from 47% a year earlier. Atradius’ 2026 Payment Practices Barometer found that about seven in ten firms across North America experience late B2B payments.
Most telling for this index: NACM reported in September 2026 that credit managers are seeing more customers request extended terms, and some shift from 30-day to 45-day payment on their own. In practical terms, that’s a stream of broken or rewritten commitments, and an aging report can’t tell you which customers are doing it.
Aging tells you what has already happened. A promise tells you what the customer says will happen next. Comparing the two is where the insight lives.
What Counts as a Promise to Pay
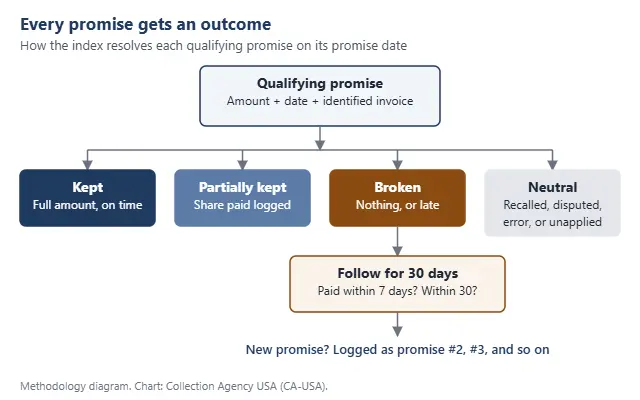
For this index, a qualifying promise to pay is a specific commitment by a business customer to pay a stated amount by a stated date against an identified receivable. If any of those three is missing, it’s collection intelligence, not a measurable promise.
| Qualifies | Doesn’t qualify on its own |
|---|---|
| “We’ll ACH $12,400 on invoice 4471 by Friday the 14th.” | “We’re working on it.” |
| “$5,000 on the 1st and the balance on the 15th.” (recorded as two installments) | “Payment should go out soon.” |
| “Accounts payable approved it; $3,250 goes out Tuesday.” | “I’ll talk to accounting.” |
| A signed payment arrangement with dated installments | “We intend to pay this month.” |
Some promises end in ways that are neither kept nor broken. These get their own status so they don’t quietly inflate either side of the calculation:
- The account was recalled by the client before the promise date.
- A documented dispute arose that affects the promised amount. (Oracle’s collections software, for example, won’t let a collector record a promise against a transaction that’s in dispute.)
- The promise was entered in error.
- The payment arrived but wasn’t yet applied to the account.
“Kept” Has Two Definitions, and We’ll Publish Both
A strict definition is the most honest. It’s also a little unforgiving, because an ACH can take a day to settle and a check mailed on time can arrive late. Enterprise systems handle this with grace periods; Oracle’s collections tools let organizations set a number of grace days before a promise counts as broken.
So the index will report two views, side by side:
| View | Definition |
|---|---|
| Strict kept rate (headline) | The full promised amount is received and applied to the agreed receivable on or before the promised date |
| Operational kept rate | The full promised amount is received within a disclosed short window after the promise date, such as three business days |
The goal isn’t whichever definition produces the higher number. It’s a definition that’s disclosed up front and never changes after the results come in.
The Core Metrics
| Metric | Formula | What it answers |
|---|---|---|
| First-Promise Kept Rate (headline) | First qualifying promises paid in full by the promise date ÷ first qualifying promises that reached their due date × 100 | When a customer makes its first specific commitment, how often does it do exactly what it said? |
| Promise Dollar Fulfillment Rate | Dollars received by promised dates ÷ dollars promised for those dates × 100 | How much promised cash actually arrived? |
| Partial Fulfillment | Amount paid by the promise date ÷ amount promised, recorded per promise | How often do customers pay some, but not all, of what they promised? |
| Broken-Promise Recovery (7-day and 30-day) | Broken promises where the promised amount arrives within 7 or 30 days of the missed date ÷ all broken promises × 100 | Was it a promise missed by a few days, or the start of prolonged nonpayment? |
| Installment Kept Rate | Installments paid as scheduled ÷ installments due × 100 | Are payment-plan installments honored? |
| Payment-Plan Completion Rate | Plans paid in full ÷ plans that reached their final due date × 100 | Paying two installments of a twelve-month plan isn’t the same as finishing it |
| Median Days From Promise to Payment | Median of (payment date − promise date) for paid promises | How quickly does cash follow a commitment? |
Why the first promise is the headline. If second, third and fourth promises are pooled into one average, an account that needed four attempts looks the same as one that paid the first time. The first promise asks the cleanest question there is: when a business commits, does it follow through?
The 90% That’s Really 8.3%
This is the single most important methodology decision in the index, so it gets its own section.
Suppose ten promises mature. Nine are $1,000 promises, and all nine are kept. One is a $100,000 promise, and it breaks.
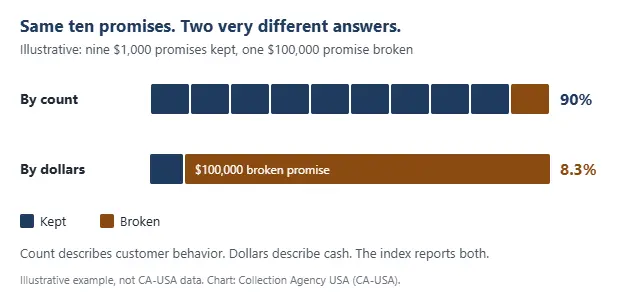
The count-based kept rate is 90%. It sounds excellent. But only $9,000 of the $109,000 promised arrived, so the dollar fulfillment rate is 8.3%.
Neither number is wrong. They answer different questions: count-weighted results describe customer behavior; dollar-weighted results describe cash. A PTP figure published without both, and without the balance mix behind it, can mislead in either direction. The index will always report both.
The Promise Fulfillment Curve
Instead of a single overall PTP percentage, the index tracks performance by promise sequence:
| Promise | The question |
|---|---|
| First | Did the customer honor its first specific commitment? |
| Second | After the first commitment broke or changed, was the next one kept? |
| Third | What happens after two failed commitments? |
| Fourth and later | Does yet another promise still carry real information? |
The practical payoff is an answer to a question every credit manager wrestles with: at what point should another promise stop counting as new information? It’s tempting to assume reliability falls with each broken promise. It may. The index won’t assume it. It will measure it, and let the data say where the drop-off happens, if there is one.
How Results Will Be Segmented
An overall kept rate can hide more than it shows. Every published result will be broken out along these dimensions, with the sample size shown beside each cell:
| Dimension | Buckets | The question it tests |
|---|---|---|
| Promise horizon (days between the conversation and the promise date) | 0–3, 4–7, 8–14, 15–30, 31+ | Is “Friday” more reliable than “next month”? |
| Account age when the promise was made | 1–30, 31–60, 61–90, 91–180, 181–365, 365+ days past due | Does a promise on a 45-day account behave differently from one on a 400-day account? |
| Balance | Under $1,000; $1,000–$4,999; $5,000–$24,999; $25,000–$99,999; $100,000+ | Do large commitments behave differently from small ones? |
| Industry | Construction, manufacturing, wholesale and distribution, transportation and logistics, professional services, technology, property management, education, healthcare B2B, other commercial services | Does a contractor waiting on upstream payment behave differently from a software customer stuck in procurement? |
| Channel | Phone, email, online portal, text or other permitted electronic channel, signed written arrangement | Do written commitments perform differently from verbal ones? |
The index is scoped to commercial B2B receivables, across the kinds of industries that rely on B2B commercial debt recovery. Consumer accounts, medical self-pay and other fundamentally different populations would be reported separately, if at all, and never blended into the headline to pad the sample. Balance bands may be adjusted once the real distribution of accounts is known, and any change will be disclosed.
Why a Written Promise Is Worth More Than a Verbal One
The index treats channel as a variable to measure, not a conclusion to assume. But there are two reasons, beyond payment odds, that written commitments deserve attention.
First, record quality. A promise confirmed by email or in a signed arrangement is far easier to reconcile than one reconstructed from call notes weeks later.
Second, legal context. In a number of states, a signed written acknowledgment of a debt or a partial payment can restart or extend the limitations period for collecting it. Other states don’t allow an expired period to be revived that way. The rules vary by state and by type of debt, so they’re worth understanding rather than assuming. Our guide to the statute of limitations on commercial debt covers the basics, and a qualified attorney can address specific accounts.
How Many Promises Before We Publish a Number
A percentage built on 17 promises isn’t a benchmark. Here’s the math the index will hold itself to.
For a proportion near 50%, about 400 independent observations give a conventional 95% margin of error of roughly ±5 percentage points. With 100 observations, that widens to about ±10 points.
Real collection data is messier than a textbook sample. Promises cluster within the same clients, industries and customers, and a customer who breaks one promise may be likely to break the next. Standard formulas can understate that uncertainty, so treat those margins as a floor, not a ceiling.
The publication rules:
- No headline CA-USA result until several hundred qualifying promises have matured and been reconciled.
- No segment result shown when its sample is too small to mean anything.
- Every figure published with its sample size, measurement period, account population and exclusions. A table built on 8 promises should never look the same as one built on 8,000.
What the Index Will Test, and What It Won’t Claim
Questions the data will test rather than assume:
- Do first promises perform meaningfully better than second or third ones?
- Does reliability fall as the promise horizon lengthens?
- Do older accounts produce less reliable commitments?
- Does a partial payment after a promise predict eventual resolution?
- Does a broken first promise change the odds of payment over the next 30 days?
- Do large-balance commercial accounts behave differently from small ones?
- Do written commitments produce different outcomes from verbal ones?
What the index will not do:
- Claim that a promise decides whether an account is collectible.
- Treat a missed promise as proof that a customer won’t pay.
- Offer one universal kept-rate target for every industry.
- Blend different debt populations to inflate the sample.
- Turn small samples into sweeping conclusions.
- Publish anything that identifies a client or debtor.
- Present invented or estimated CA-USA figures before real ones exist.
It also won’t replace recovery rate. An agency can post a strong overall recovery rate even when many first promises break; another can show a high kept rate on a young, easy portfolio. The PTP index answers a narrower question: once someone has committed to a payment, what happens next? When you compare agencies, ask for recovery data on portfolios that look like yours; our overview of the largest consumer and commercial collection agencies covers what to ask for.
Start Measuring Your Own Promise-to-Pay Performance This Quarter
You don’t need new software to begin. You need to stop storing promises as prose.
- Log every promise as a structured record: amount, promise date, the invoice it covers, account age, balance, channel and whether it’s the first, second or later promise on that account.
- Only log qualifying promises. No amount or no date means it’s a note, not a promise. When a customer says “soon,” ask for the amount and the date before ending the call.
- Close every promise on its date. Kept, partially kept, broken, or neutral for a documented reason (recalled, disputed, entered in error, paid but unapplied). Never leave old promises sitting in “open.”
- Follow broken promises for 30 days and record whether, and when, the money arrived.
- Report count and dollars together every month, split by first versus repeat promises.
After a few months you’ll have something most aging reports can’t give you: a record of how reliable each customer’s word actually is. That record becomes a practical input to your escalation policy. If an account has broken two promises with no dispute on file, a third promise may not be new information, and it may be time to move the account into B2B commercial debt recovery. Our guide to assigning accounts to collections explains what that handoff involves.
It also sharpens your cash forecast. If customers promise $1 million for the next 30 days, that’s useful to know. Knowing how much of what they promised has historically arrived on time is far more useful.
Promise-to-Pay (PTP) Compliance & Regulatory Standards
-
E-SIGN Act (15 U.S.C. § 7001) & NACHA Operating Rules: Payment arrangements negotiated by phone, email, or digital portals require explicit debtor authorization before any funds are pulled. Under NACHA guidelines and federal E-SIGN standards, recurring ACH drafts or postdated electronic payments require a verifiable audit trail—including date-stamped electronic signatures, IP logging, and written confirmation sent prior to debit execution.
-
Statute of Limitations Acknowledgment & Revival: Under most state contract statutes, a debtor’s partial payment or formal written Promise to Pay can legally restart or “revive” an expired or expiring statute of limitations clock. Where applicable, collectors must strictly adhere to CFPB and state-level disclosure mandates prohibiting deceptive revival tactics on time-barred accounts.
-
Regulation F Dispute Verification (12 CFR § 1006.38): If a debtor breaks a promise to pay and subsequently submits an oral or written balance dispute, all collection activity on the disputed portion must pause immediately. The agency cannot resume demand outreach until it conducts an independent investigation and provides verifiable documentation (e.g., original signed agreements, itemized account statements, or proof of services rendered).
Frequently Asked Questions
What is a promise-to-pay kept rate?
A promise-to-pay kept rate is the percentage of matured payment commitments that were fulfilled as agreed. The basic formula is promises kept divided by promises that reached their due date, times 100. A meaningful figure should also disclose how partial payments, grace periods and late payments are treated.
What is a good promise-to-pay kept rate?
There isn’t yet a standardized public benchmark for U.S. commercial receivables that CA-USA believes should be applied universally. Published definitions and vendor guidance vary, and results depend on account age, balance, industry, collection stage and portfolio type. The most useful starting point is a clearly defined internal baseline, tracked the same way every month.
Should a partial payment count as a kept promise?
Not as a fully kept promise if the customer committed to a larger amount. But treating an 80% payment the same as no payment throws away useful information. The CA-USA methodology records partial fulfillment separately and reports the share of promised dollars actually received.
Should a late payment count as keeping a promise?
Not in the headline metric, which uses the agreed date. Payments that arrive shortly afterward are captured in a separately disclosed operational kept rate with a short grace window, and later payments are captured in the 7-day and 30-day broken-promise recovery measures.
Does a broken promise mean the customer won’t pay?
No. A customer can miss a promised date and still pay later, which is why the index tracks what happens in the 7 and 30 days after a missed promise instead of treating every miss as permanent nonpayment. What a broken promise does provide is behavioral information that invoice age alone doesn’t.
Is promise-to-pay tracking better than DSO?
They measure different things. Days Sales Outstanding gives a broad view of how long receivables take to become cash. Promise-to-pay metrics show whether specific customer commitments actually happen. Used together, they give a fuller picture than either one alone.
The Bottom Line
Businesses already measure receivables by age, by DSO, by bad debt and by total recovery. One of the most forward-looking signals they have usually stays buried in collection notes: a customer told us exactly when it would pay.
Turn that sentence into structured data and it becomes measurable. Did the first promise become cash? Did the second? How much arrived, and how late? Did reliability change as the account aged?
This methodology edition sets the definitions first, so they can’t be bent to fit the results later. When the first dataset is ready, the index will answer one very specific question: when a business says “We’ll pay Friday,” how often does Friday actually mean Friday?
About the CA-USA Promise-to-Pay Index
The Collection Agency USA (CA-USA) Promise-to-Pay Index is a research initiative studying how payment commitments on delinquent commercial receivables are fulfilled. Future results will be drawn from anonymized commercial accounts serviced by CA-USA and its authorized collection partners. It examines first and repeat promises, amounts promised and received, payment timing, account age, balance, industry, payment arrangements and outcomes after broken promises. The methodology is published before any results so the definitions stay transparent and fixed. Every future data release will disclose sample size, measurement period, account population, exclusions and methodology alongside each figure.
Questions about the methodology, or B2B accounts where the promises have stopped meaning much? Contact the CA-USA team at support@CollectionAgencyUSA.com or 1-844-666-7890.
Sources
- SAP, Promise to Pay (FI-CA documentation) and Promises to Pay KPI app
- Oracle, Advanced Collections User Guide: promises to pay and Oracle Banking Collections and Recovery: Promise to Pay
- Thomson Reuters, Five KPIs for the Collections Department
- OpsDog, Percentage of Outbound Calls Resulting in Promise to Pay
- VCC Live, 11 critical debt collection KPIs
- HighRadius, Top 10 Collections KPIs & Performance Metrics
- NACM, Payment delays rise as customers hold tight to cash (September 2026)
- Intuit QuickBooks, 2026 Small Business Late Payments Report (July 2026)
- Atradius, B2B Payment Practices Trends in North America 2026 (September 2026)
2027 Index — Methodology published September 2026. First results will be released after the required sample threshold is reached.